
A shift ends. Output hit the plan, nothing major broke down, and quality looked fine walking the floor. Then OEE comes back at 51.0%, and the team is left staring at a number that doesn’t match what they just watched happen.
That gap is the reason OEE is worth calculating properly. On its own, the percentage explains almost nothing. The three components underneath it, and the specific losses inside each one, tell you what happened on the line.
Below, I take one full production run, calculate its OEE step by step, then look at where the metric breaks down in real plants: fuzzy definitions, time boundaries that shift from one comparison to the next, and teams that stop reading as soon as they see the percentage.
Table of Contents
Table of Contents
What OEE Actually Measures
Overall Equipment Effectiveness combines three separate questions into one number:
| Component | Formula | Question it answers |
|---|---|---|
| Availability | Run Time ÷ Planned Production Time | Was the equipment available to run? |
| Performance | (Ideal Cycle Time × Total Count) ÷ Run Time | Did it run at the rate it should have? |
| Quality | Good Count ÷ Total Count | How much of what it made was good? |
Two lines can post the same OEE for completely different reasons. One loses hours to breakdowns and changeovers, yet runs fast and clean whenever it is up. The other runs almost the whole shift without a hitch and loses just as much to a steady trickle of scrap. Same final number, two very different problems. Only the three components show you which one you have.
The OEE Formula
OEE = Availability × Performance × Quality
The math is simple enough to do in your head. The hard part is consistency. Planned Production Time, downtime, ideal cycle time, and good and total counts have to be defined the same way every time someone runs the calculation. Change one of those definitions between shifts, lines, or plants, and two percentages can look alike while measuring different things.
A Complete OEE Calculation, Step by Step
Here’s the shift data for one fictional packaging line:
| Production data | Value |
|---|---|
| Planned production time | 480 minutes |
| Downtime | 72 minutes |
| Run time | 408 minutes |
| Ideal cycle time | 0.51 min/unit |
| Total units produced | 640 |
| Rejected units | 160 |
| Good units | 480 |
The figures are fictional, built specifically to make the calculation, and the mistakes people make with it, easy to see.
Calculate Availability
Availability = Run Time ÷ Planned Production Time
Run Time = 480 − 72 = 408 minutes
Availability = 408 ÷ 480 = 85.0%
The line ran for 85% of the time it was scheduled to. Those 72 minutes of downtime still need to be split into categories (failure, setup, adjustment) before anyone can act on them. As a single total, they only tell you that time was lost.
Calculate Performance
Performance = (Ideal Cycle Time × Total Count) ÷ Run Time
Performance = (0.51 × 640) ÷ 408 = 80.0%
During the 408 minutes the line was running, it produced at 80% of its rated speed. Teams tend to underestimate this component. A line that moves all shift looks busy, while reduced speed and short stops that nobody logs quietly eat into its capacity.
Calculate Quality
Quality = Good Count ÷ Total Count
Good Count = 640 − 160 = 480 units
Quality = 480 ÷ 640 = 75.0%
A quarter of what the line made in that window wasn’t good output. That’s a heavy loss, and it deserves its own investigation, separate from Availability and Performance.
Calculate the Final OEE
OEE = 85.0% × 80.0% × 75.0% = 51.0%
See It Applied to a Different Line
The example above uses one data set. In this video, I run the same four steps on a different production line, with different numbers, so you can watch the method work outside a single example.
What a 51% OEE Actually Tells You
51% tells you where the line lost effectiveness. The why is still ahead of you.
Quality is the weakest of the three here, so it’s the obvious place to start. But “75% Quality” doesn’t say whether those 160 rejects came from one recurring defect, several unrelated ones, a startup condition, or a material problem that only shows up under certain settings. The calculation has narrowed the search. Now someone has to go and do it.
That’s what the Six Big Losses framework is for.
The Six Big Losses
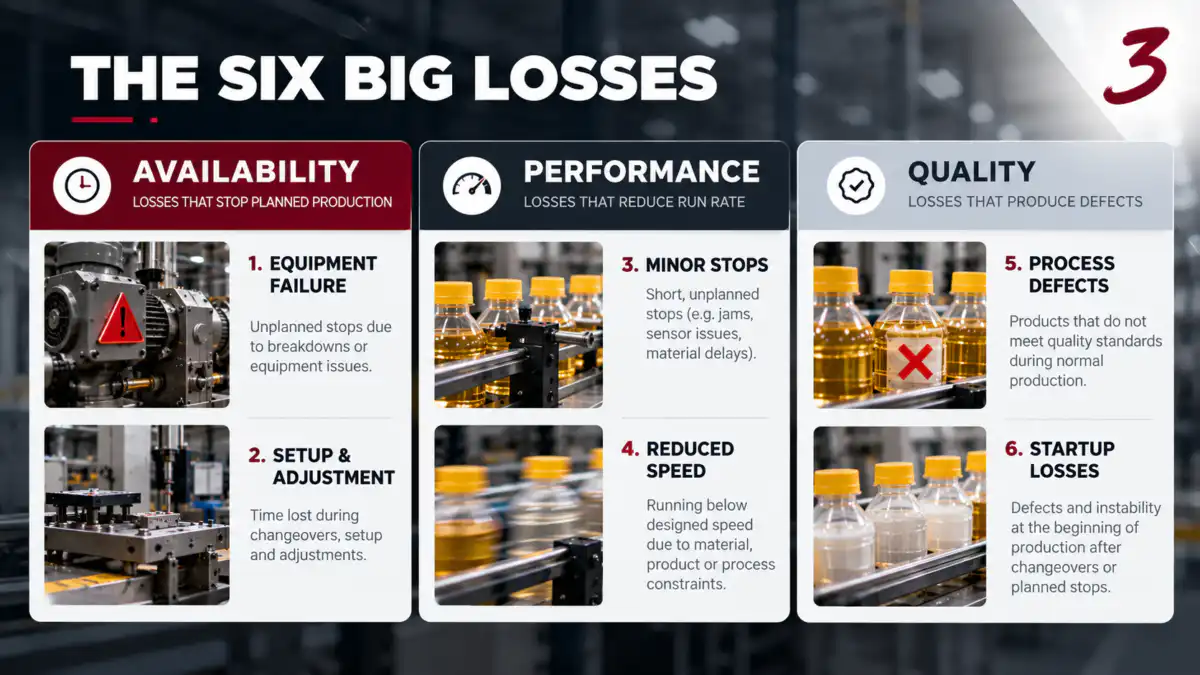
Availability Losses
Anything that keeps equipment from running during planned time. Equipment failure is the obvious one; setups and changeovers also belong here, depending on how your plant’s OEE methodology treats planned events.
Performance Losses
Losses that happen while the equipment runs, but too slowly. Minor stops are the sneaky ones. A five-second jam looks like nothing, yet a shift full of them can cost more capacity than the one breakdown that made it into the maintenance log.
Quality Losses
Scrap, defects, and startup losses that reduce Good Count relative to Total Count. Before comparing Quality figures across shifts or lines, get everyone to agree on what counts as a defect and what counts as reworkable product. That disagreement derails more OEE comparisons than people expect.
For a deeper breakdown of each loss category, see Vorne’s Six Big Losses reference.
Common OEE Calculation Mistakes
Using an unclear ideal cycle time. If “ideal” quietly drifts into “whatever the machine usually does,” Performance stops measuring anything real. It needs to be a defined engineering value for that specific product and process.
Changing the time boundary between comparisons. One shift excludes a scheduled break from Planned Production Time; another includes it. Now the two OEE figures measure different things, however similar they look side by side.
Using Good Count in the Performance formula. Performance runs on Total Count. Quality is where Good Count comes in. Swap them and you’re double-counting the quality loss while understating Performance.
Ignoring minor stops. One stop is easy to forget. Fifty in a shift add up, and this is the most common way Performance losses go untracked.
Averaging instead of multiplying. (85% + 80% + 75%) ÷ 3 = 80%. That is not the OEE. 85% × 80% × 75% = 51%. The gap between those two numbers is usually the first real surprise for anyone new to the metric, and it’s a large part of why “everything’s running fine” and “OEE is 51%” can both be true at the same time.
Treating OEE as the root cause. It tells you where the effectiveness went. Getting to why still takes the downtime detail, the speed data, the defect breakdown, and structured problem-solving.
Using OEE to Drive Improvement
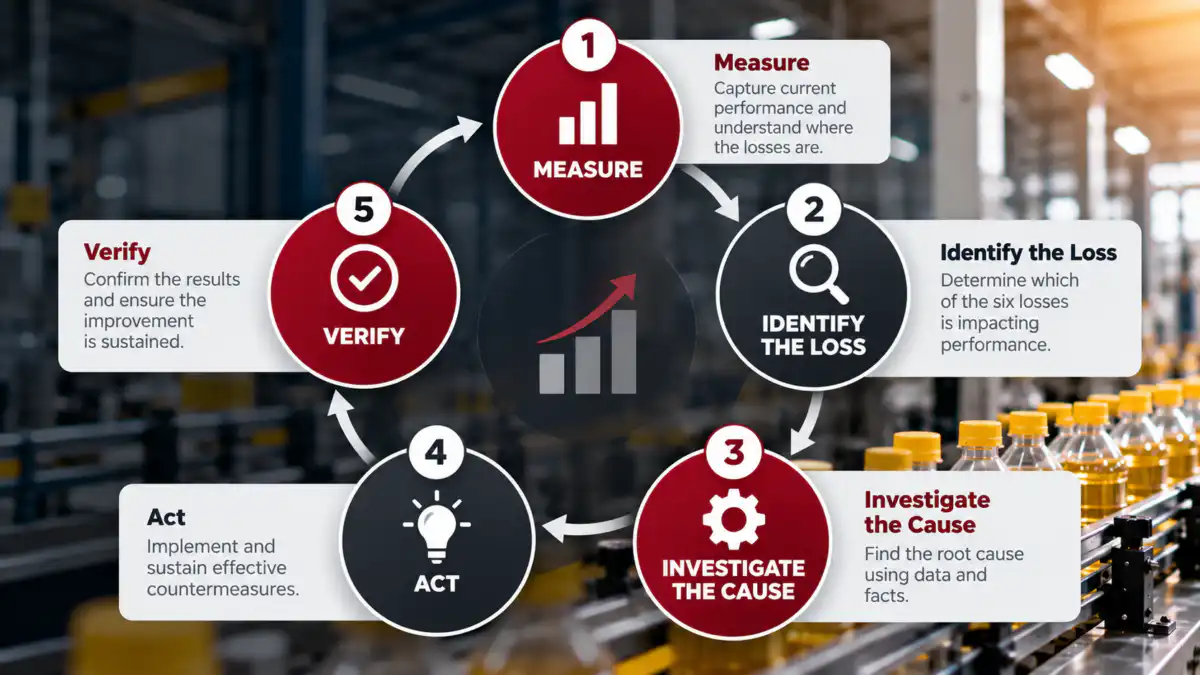
Once the measurement itself is trustworthy, start with whichever component is dragging the number down, then go one level deeper: Availability points you to the downtime categories, Performance points you to speed and minor stops, Quality points you to defect types and the conditions around them.
Measure → identify the loss → investigate the cause → act → verify.
Verify is the step most improvement efforts skip. A countermeasure that worked for one shift is still a hypothesis. Check again a week later before you call it a fix.
OEE and Daily Management
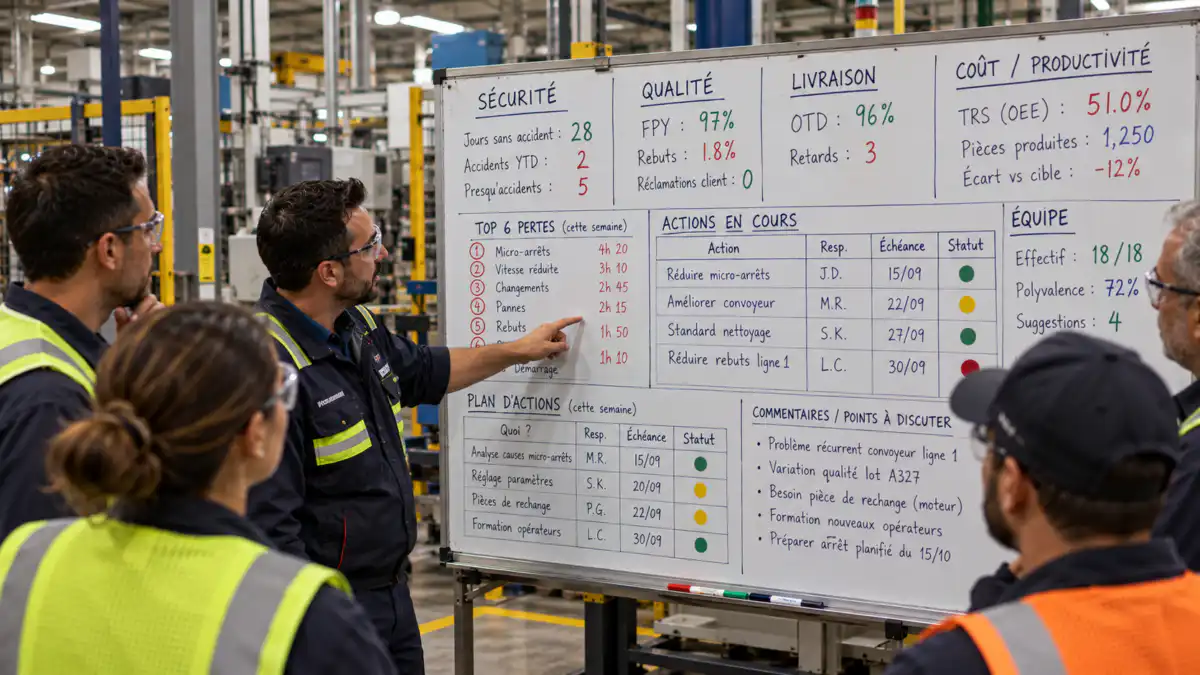
A dashboard reports what happened. Daily management decides what to do about it, and it works best when the conversation moves past the headline number fast: what drove yesterday’s Availability loss, which downtime category was largest, where Performance fell short, whether minor stops repeated, what quality losses came up, who owns today’s action, and how the team will know whether it worked.
→ For more on building this into a standing routine, see the Lean Enterprise Institute’s resources on daily management.
From Manual OEE to Digital OEE

You don’t need sophisticated systems to start. Starting by hand is often the smarter move, because it forces agreement on definitions before they get locked into software.
Manual data collection: production quantity, rejects, downtime and reasons, tracked on paper or in a spreadsheet. What matters is whether the numbers are accurate, consistently defined, and available soon enough to act on. Paper can do all three.
Digital data collection: connected equipment automating the capture, surfacing recurring downtime and minor stops that manual logging typically misses entirely.
Analytics and AI: combining equipment, production, and quality data to catch patterns that wouldn’t show up in a single shift report. Very useful for investigation. You still need to understand the operation, though, and AI won’t repair a definition that was wrong from the start. Build a sophisticated dashboard on a bad definition and you get the wrong number faster.
Get the Free OEE & Daily Management Template
Everything above is yours to use as is. If you’d rather not rebuild it yourself, the template puts it all in one Excel file.
Download the Free TemplateThe template includes a working calculation worksheet built on the exact definitions used in this guide, a Six Big Losses reference sheet, and a daily management question set ready to run in a shift huddle.
Try the OEE Calculator
Enter your own line’s five numbers: Planned Production Time, Downtime, Ideal Cycle Time, Total Count, and Good Count. The calculator runs them through the same formulas as the example above.
Frequently Asked Questions
How to calculate OEE?
OEE = Availability × Performance × Quality. In this guide’s example: 85% × 80% × 75% = 51% OEE.
What is considered a world-class OEE?
85% is the figure most commonly cited as world-class, particularly for discrete manufacturing. Use it as a reference point. Product mix, process type, and the way your organization defines its terms all change what’s realistic for a given line.
What is a good OEE?
There’s no single benchmark that applies across every operation. A number is far more useful read against its own trend, and the losses behind it, than compared to a generic industry figure pulled from a different kind of process entirely.
What are the Six Big Losses?
Equipment failure and setup/adjustment under Availability; minor stops and reduced speed under Performance; process defects and startup losses under Quality.
What’s the difference between OEE and TEEP?
OEE measures effectiveness during planned production time. TEEP extends the same logic to all calendar time, adding a utilization layer on top of the effectiveness measure.
Can OEE be 100%?
In theory, it would mean Availability, Performance, and Quality were each 100% under your definitions. In practice it’s a theoretical ceiling, and most lines will never operate there.
Quick Reference: The 4-Step Calculation
If you just want the steps without the full walkthrough above, here’s the condensed version, with the same numbers and formulas.
Calculate OEE by multiplying Availability, Performance, and Quality using your production line's planned time, downtime, cycle time, and unit counts.
Total Time: 5 minutes
Step 1 : Calculate Availability
Subtract downtime from planned production time to get Run Time. Divide Run Time by Planned Production Time. Example: 408 ÷ 480 = 85.0% Availability.
Step 2: Calculate Performance
Multiply Ideal Cycle Time by Total Count, then divide by Run Time. Example: (0.51 × 640) ÷ 408 = 80.0% Performance.
Step 3: Calculate Quality
Subtract rejected units from Total Count to get Good Count, then divide Good Count by Total Count. Example: 480 ÷ 640 = 75.0% Quality.
Step 4: Calculate the Final OEE
Multiply Availability × Performance × Quality. Example: 85.0% × 80.0% × 75.0% = 51.0% OEE.
Final Thoughts
Behind 51.0% there are three separate stories: 85% Availability, 80% Performance, and 75% Quality, multiplied down to one number.
The calculation is where the work begins. Find the loss, understand what caused it, act on it, and check whether the gain held. Teams that run this loop use OEE to manage the floor. Teams that skip it end up with one more line on a report.
About the Author
Zouhair Lahia is the founder of TRI Principles Institute and an Operational Excellence and Lean transformation leader with over 20 years of experience across aerospace, automotive, and manufacturing operations. A Lean Six Sigma Black Belt and CPIM-certified professional, he works as a consultant through TRI Principles Institute, building measurement systems, OEE frameworks included, that hold up on a real shop floor.
Reviewed by: Tri Principles Institute · Last reviewed: September 2026
1 thought on “How to Calculate OEE: Formula, Real Example, and a Framework That Actually Improves Performance”